
A Delhi think tank says India’s minimum wages sit so far above what workers can earn that they push people out of formal jobs. Its own data show that 64 per cent of workers already earn less than the legal floor, so the floor cannot be doing the work the report gives it. This essay checks the report against the Indian studies it leaves out, and against a recent firm-level paper that shows what a rigorous estimate in Indian trade policy looks like.
The sentence I keep returning to is on page 15 of the Foundation for Economic Development’s April 2026 report, Minimum wages hurt the most vulnerable workers. It says that 64 per cent of India’s workers earn less than the legal minimum, and it calls that “the normal state of employment”. Two pages later the report describes its own data as snapshots and correlations, and then says that the data, read together with theory and causal research, provide very strong evidence that India’s labour protections have hurt workers. The first statement is hard to square with the second.
The report matters because the argument is arriving at a live moment. The four labour codes took effect on 21 November 2025, and the central rules under the Code on Wages were notified on 8 May 2026. The Code requires the Centre to fix a national floor wage, and every state minimum wage must then sit above it. As of the latest sources I could find, from mid-July 2026, no floor wage amount has been notified. The Ministry’s rules lay out the method but the figures for each skill category are still to come. A report that tells the Ministry to let workers accept wages below the floor, and to pay wage subsidies in place of future increases, is therefore an input into a decision that has not been taken. I followed the labour codes from assent to effect in Assent without effect.
I think the report’s central inference fails on its own numbers. A wage floor works through employers: an employer who must pay at least a certain amount decides whom to hire. If most workers are already paid under the floor, either because the law does not reach them or because nobody enforces it, then the floor is not the price that most hiring decisions are made at. It cannot then be the main reason that 88 per cent of the workforce is informal. The Indian studies that exploit differences in enforcement point the same way: what a minimum wage does depends on whether anyone makes employers pay it.
This essay is about the gap between a wage that is written down and a wage that is paid. It sets out what FED claims, checks which workers the floor can reach, reads the Indian evidence on enforcement, tests the cross-state charts and the export figure, and then holds the report against the standard set by an Indian trade paper that estimates a loss using firm-level data and world prices.
What the report claims
FED’s argument starts from a measure of bite. India’s minimum wage, which FED builds as an average across states, is 169 per cent of the median casual worker’s earnings, 113 per cent of the median self-employed worker’s and 90 per cent of the median regular worker’s, and about 77 per cent of monthly per-capita GDP, against about half that in Vietnam, Bangladesh, China and South Korea. The report then sets out a mechanism: when the floor sits above what a worker can produce, employers respond in nine ways, and eight of them leave workers worse off. Macro charts follow, covering informality of about 88 per cent, an annual shortfall of $60 billion in low-skill exports, a slower exit from agriculture than China managed, and state-level scatterplots that relate the floor to formal employment, median wages and manufacturing.
From these the report recommends that workers and employers negotiate wages freely, even below the current floor; that wage subsidies replace further increases; and that any national floor reflect regional conditions. I will come back to the third recommendation, because the Code already permits it.
The sentence on page 15
FED’s own Figure 4 puts the share of workers who earn below the minimum at 40 per cent in Rajasthan and 79 per cent in Odisha, with 64 per cent across the country, and it counts regular, casual and self-employed workers together. The report reads this as proof that the floor is set too high. The same figures support a different reading, which is that the floor is not enforced.
These are two hypotheses with different predictions. If the floor were enforced and too high, we would expect workers to be missing from the data: employers would not hire them at all, so the people we observe would mostly earn above the floor. FED instead observes a population of working people, most of whom earn less than it. People are being employed below the legal price. That is what a price floor that does not bind looks like.
The research on India has been saying this for a decade. Mansoor and O’Neill merged the National Sample Survey rounds from 1999 to 2011 with the Labour Bureau’s schedule of more than 1,500 separate state minimum wages. They found non-compliance as high as 90 per cent for some unskilled workers. Their central result is that minimum wages raise wages without a matching fall in employment, that household consumption rises as a result, and that compliance matters for how much. The paper appeared in World Development in 2021. FED does not cite it.
Who the floor reaches
A minimum wage law governs a relationship between an employer and an employee. The Periodic Labour Force Survey for 2023-24 shows how few workers are in that relationship. More than half of the workers surveyed, 58.4 per cent, were self-employed. Another 21.7 per cent earned regular wages or salaries and 19.8 per cent were casual labourers. The Economic Survey noted that the self-employed share rose from 52.2 per cent in 2017-18 to 58.4 per cent in 2023-24.

FED states the national figure of 64 per cent as a share of all workers. A self-employed person who runs a tea stall or farms a plot has no employer to pay a wage, and her monthly earnings are what is left after costs. Comparing that figure with a daily wage notified for scheduled employment tells us how her earnings compare with a number. It says nothing about whether a law was broken.
Mansoor and O’Neill handle this by leaving the self-employed out of their sample because the Minimum Wages Act does not cover them. If the same step were applied to FED’s data, the 64 per cent and the 47 per cent would be computed over, at most, the 41.5 per cent of workers who work for wages. The base of the headline figures is a population in which most people have no employer.
The same problem affects FED’s comparison with NREGA, which it uses to argue that even the government pays well below its own floor. The rate of pay under the employment guarantee is set by the Centre under Section 6(1) of the Act, notwithstanding anything in the Minimum Wages Act. The Ministry of Rural Development delinked it from state minimum agricultural wages in January 2009, and by 2015-16 the scheme’s rate was below the state agricultural minimum in 15 states.
Parliament’s own standing committee has questioned why a rate near Rs 200 a day persists where state labour rates are far higher, and recommended that NREGA wages follow the Rs 375 a day that a central expert committee had proposed. A rate that Parliament’s own committee has questioned is an administrative choice, and it tells us little about what a day of labour produces.
What the Indian studies find when enforcement varies
Vidhya Soundararajan’s paper in the Journal of Development Economics is the closest thing to a direct test of the question FED asks, and it has a design FED could have copied. She compares districts on either side of state borders, where one side has a different minimum wage, and she sorts the comparisons by how strictly each regime enforces the law.
In weak enforcement regimes she finds negligible wage effects and employment effects that are negative or null. In stricter regimes she finds strong positive wage effects and employment effects that are positive or null in most specifications. She reads the pattern as consistent with theories of imperfect enforcement in labour markets where employers hold wage-setting power. The estimates hold up to alternative definitions of enforcement and to instrumenting for it.
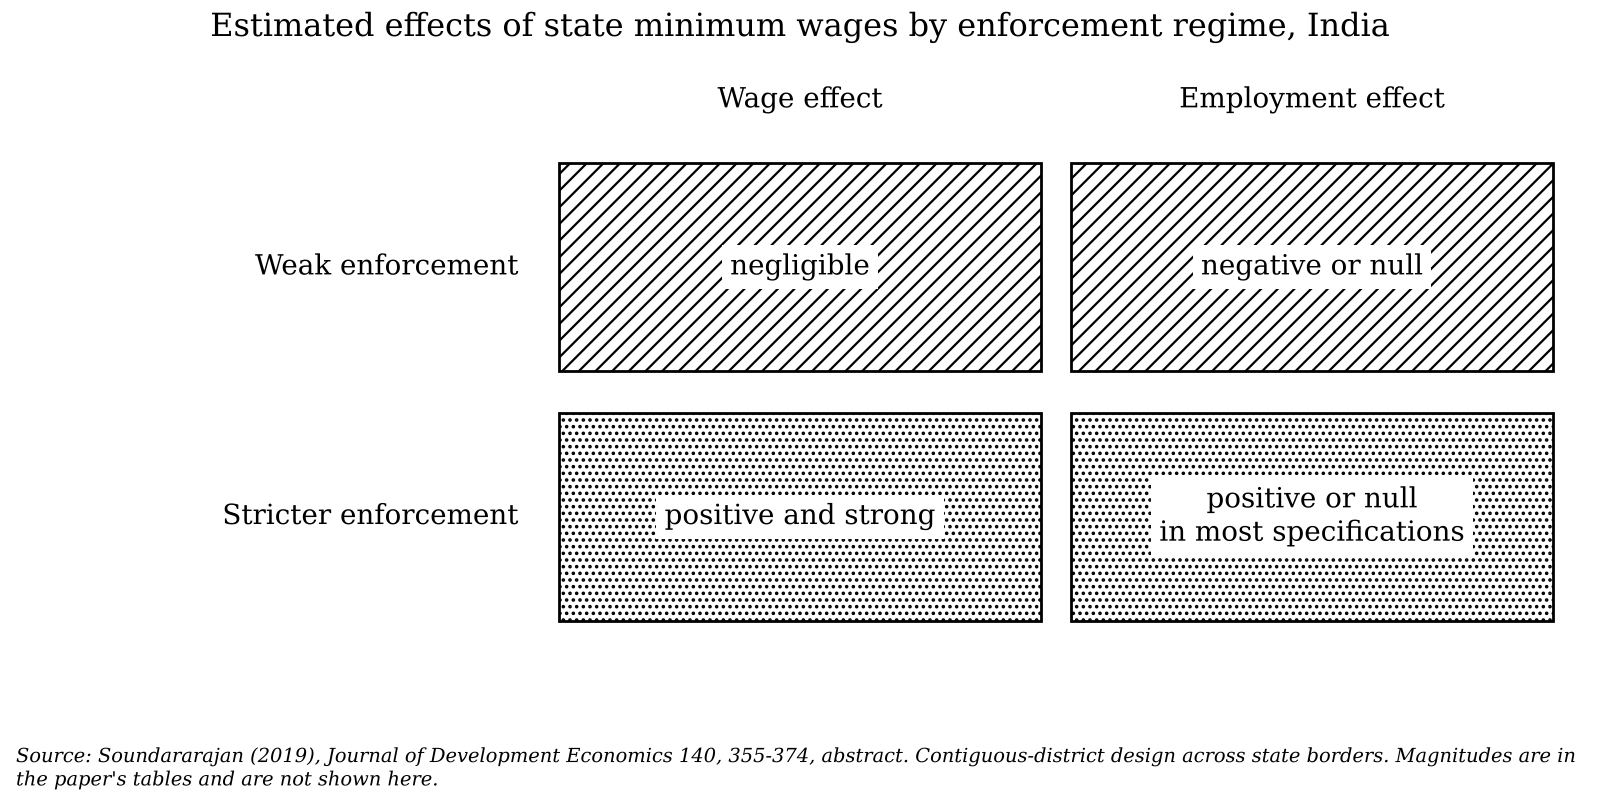
FED’s world, where 64 per cent of workers sit below the floor, looks like the weak-enforcement world of this paper, and in that world the paper finds that wages barely move. A floor that does not move wages is a poor candidate for the force that keeps most of the workforce informal. The same abstract holds a finding that FED could cite. In the weak-enforcement regime the employment effects are negative or null.
A policy that raises nobody’s pay and may cost some jobs is a poor policy. The remedy the evidence points to is enforcement, since in the strict regime the effects turn positive or null, and FED recommends removing the floor’s force.
Fourteen points and a denominator
FED’s three state-level charts each carry 14 points, one for each state. The horizontal axis is the minimum wage relative to per-capita GDP. The vertical axis is the share of formal employment, or the median wage relative to the floor, or the manufacturing share of output. The report says that states which set their floor well above per-capita income are the ones with the weakest results.
Per-capita GDP appears in the denominator of the variable on the horizontal axis. That choice has a mechanical consequence. Suppose two states set the same notified minimum, Rs 400 a day, and one has twice the per-capita income of the other. The ratio of floor to income in the poorer state will be twice that of the richer. The poorer state will also, on almost any measure, have a lower formal share, a lower median wage and a smaller manufacturing base, because those things rise with income. The chart will show a downward slope between the ratio and each outcome even if the floor has no effect on anything. These numbers are hypothetical and I use them only to show the arithmetic. The point is that the ratio on the horizontal axis can be mostly a restatement of per-capita income, which FED does not control for.
The sample adds to the difficulty. A footnote explains that the India figure is the average minimum wage of the 14 most populous states, excluding Bihar, because Bihar’s PLFS wages “appeared to have errors”, with reported wages higher than those in the southern states. Bihar is the third most populous state in India. FED does not show the check that led it to call the data erroneous, and I do not know which way dropping it moves the average. What we know is that Bihar’s unskilled minimum wage was raised to Rs 436 a day from 1 April 2026, a figure that is not low by the standard of the poorer states. (That is the 2026 rate and the PLFS data are from 2023-24, so it is a pointer and not a test.)
The report also never says which minimum wage it uses. India has no single rate. State schedules list four skill categories for each scheduled employment, with different rates for each. The report’s text does not say which category, which zone or which conversion from a daily to a monthly rate it applied, and its charts use daily figures in some places and monthly figures in others. The comparison cannot be reproduced from the report. Its numbers may be right, but a reader has no way of checking them.
The export figure and the paper it comes from
The strongest-sounding number in the report is the $60 billion shortfall in low-skill exports. FED presents it as the primary reason India’s move out of agriculture has stalled, and connects it to the cost of formality. The figure comes from Chatterjee and Subramanian’s 2020 paper on India’s export-led growth, which found that India exports about $60 billion less in low-skill goods every year than its labour endowment would predict.
In reading the paper, minimum wages do not appear among them, nor do labour laws, infrastructure, exchange rates or trade policy as causes of the shortfall. The authors attribute it to India’s failure to traverse the Lewis curve for low-skill manufacturing, and they describe a revealed preference for specialising in higher-skill activities. The abstract says that India has been an exemplar of export-led growth that has nevertheless underperformed in unskilled manufacturing exports. FED has taken the number and supplied a cause that the authors do not give.
The causal story also has a gap on its own terms. FED argues that informality is corrosive to exports because global buyers insist on compliance with local labour law. That may be true. It is a point about enforcement and registration, and it would hold with or without a high floor. An exporter that cannot show compliance has a compliance problem. Nothing in the chain connects the level of the floor to that problem, and FED’s own data say the floor is widely not paid.
What a rigorous estimate looks like
The benchmark I use is a paper by Abhishek Anand and Naveen Joseph Thomas, Free Trade on Paper, Protection in Practice, released as an unpublished preprint in January 2026. It asks a question about trade policy that has the same shape as FED’s: does a policy do what its text says? The case is viscose staple fibre, an input for apparel. Tariffs on it were cut under the ASEAN-India trade agreement, and anti-dumping and other measures then offset the cut.
The authors combine firm-level sales data with international trade prices and estimate that the regime generated between US$2.5 and US$3.1 billion in monopoly rents between 2010 and 2024. Downstream manufacturers bore the cost, and India’s share of global exports of fibre-based yarn and garments fell. A column in ThePrint discusses the findings for a general reader.
The design has features that FED’s report lacks. The paper defines its quantity, the rent, as the gap between what firms charged and what they would have charged at world prices, so the counterfactual is named. Its observations sit at the level where the behaviour happens, the firm. FED defines a quantity, the share of workers below the floor, and then moves to a causal claim without saying what employment would have been at a lower floor. Its charts carry 14 points where the unit of behaviour is the employer, and it describes its own evidence as snapshots and correlations while claiming very strong evidence.
What the Code already allows
FED’s third recommendation is to allow any national floor wage to reflect regional reality, and it warns that a uniform floor would sit above the median in poorer states and make most of their workers legally unhireable.
The Code on Wages says the Centre may fix different floor wages for different geographical areas, and the Taxmann analysis of Rule 10 describes regional variation as permitted. A proviso to Section 9 permits it. The expert committee that the Ministry set up under Anoop Satpathy recommended a single need-based figure of Rs 375 a day as of July 2018 and, alongside it, five regional figures, with the lowest, Rs 342 a day or Rs 8,892 a month, for Assam, Bihar, Jharkhand, Madhya Pradesh, Odisha, Uttar Pradesh and West Bengal, and the highest, Rs 447 a day or Rs 11,622 a month, for Delhi, Goa, Haryana, Himachal Pradesh and Punjab.

So the recommendation asks for what the statute allows and what the expert committee proposed. The fear it is aimed at is a uniform floor, and no uniform floor has been notified. FED also treats Rs 9,000 a month as the benchmark that competitor countries imply. The committee’s 2018 estimate for a family, at July 2018 prices, was already Rs 9,750. Not seeing much a recommendation here then.
Where FED may be right
The report cannot be dismissed on its method alone, and I do not want to leave the impression that the literature is one-sided. Several findings in the minimum wage literature point FED’s way.
In an experiment on an online labour platform, John Horton randomly imposed minimum hourly wages on employers posting jobs. Fewer firms hired, hired workers earned more, hours fell sharply, and in the equilibrium after the platform imposed a market-wide minimum there was a large reduction in postings where the floor would bind. A Danish study, by Kreiner, Reck and Skov, uses the jump in the minimum wage at age 18 and finds a 40 per cent rise in the hourly wage, a 33 per cent fall in employment and a 45 per cent fall in hours. And the famous New Jersey study by Card and Krueger was contested on payroll data by Neumark and Wascher, whose estimate was a decline in employment, before Card and Krueger answered with administrative payroll data that showed no relative loss.
These studies come with limits. Horton’s setting is a platform for short freelance projects. The Danish discontinuity concerns teenagers in a collectively bargained system. The New Jersey dispute concerned fast food in a rich country. None of them is a national labour market in which most workers are self-employed or casual.
The larger syntheses lean the other way. Cengiz, Dube, Lindner and Zipperer examine 138 state minimum wage changes in the United States and find that the number of low-wage jobs stayed essentially unchanged over five years, although they also report some evidence of reduced employment in tradable sectors. Doucouliagos and Stanley meta-analysed 64 US studies, found publication selection bias slightly larger than the average reported effect, and concluded that once it is corrected little or no evidence of a negative association remains. Arindrajit Dube’s review for HM Treasury found a very muted effect on employment in developed countries, and saw room for a UK minimum of 60 per cent to two-thirds of median hourly earnings.
That last number matters for FED’s case. If FED is right that India’s floor is 169 per cent of the median casual worker’s pay, the country would be far outside the range any of these studies covers, and caution about the extrapolation would be warranted. One cannot confirm the ratio, it depends on the choices described above, none of which the report states. A reader can accept that very high floors are risky and still ask whether this report has shown that India’s is one.
What would settle it
Some pieces of work would answer the question in a way that this report does not. FED can publish the list of state minimum wages it used, the skill category and zone it chose, the conversion to monthly rates and its treatment of Bihar, because without them nobody can check the 64 per cent. It can restrict the compliance exercise to workers with employers, as Mansoor and O’Neill do, and report wage workers separately from the self-employed. Researchers can borrow the border-district design in Soundararajan’s paper and extend it to the 2020s, using inspection records as a measure of enforcement. And someone with access to firm-level data, such as the Annual Survey of Industries, can ask what happened to employment in firms whose wage bills sat close to a newly notified minimum. That is the move the VSF paper makes for fibre prices: it estimates a counterfactual from observed firms.
Until that work exists, the evidence supports a narrower claim than the report makes. India’s minimum wages are widely unpaid, and where they are unpaid the studies find little effect on wages and sometimes a negative effect on employment.
Further reading
The FED report and the benchmark paper
FED, Minimum wages hurt the most vulnerable workers (April 2026) · Anand and Thomas, Free Trade on Paper, Protection in Practice (preprint) · ThePrint on the VSF findings · Chatterjee and Subramanian, India’s Export-Led Growth (Ashoka, 2020)
Minimum wages and enforcement in India
Mansoor and O’Neill, IZA DP 13298 · Mansoor and O’Neill, World Development (2021) · Soundararajan, Journal of Development Economics (2019) · PIB on the Satpathy Committee report (2019)
The wider evidence on employment effects
Cengiz, Dube, Lindner and Zipperer (2019) · Dube, review for HM Treasury (2019) · Doucouliagos and Stanley (2009) · Horton, American Economic Review (2025) · Kreiner, Reck and Skov, Review of Economics and Statistics (2020) · Neumark and Wascher (1995) · Card and Krueger reanalysis (1998)
The Code on Wages and the floor wage
PRS, Code on Wages (Central) Rules, 2026 · Taxmann on Section 9 and Rule 10 · LawSikho on the national floor wage · The Wire on the Rs 375 recommendation
Employment status, NREGA rates and state minimum wages
PLFS Annual Report 2023-24, summary · Economic Survey on self-employment (Tribune) · Lok Sabha answer on Section 6(1) of the NREGA · India Legal on NREGA and minimum wages · PRS summary of the standing committee report on NREGA wage rates · Bihar minimum wages from 1 April 2026
Earlier on policygrounds
Assent without effect · Recorded as stated
Varna is a development economist and writes at policygrounds.press.


















Write a comment ...